How to Find Quality Growth Stocks: A Practical Framework
PRISM EditorialUpdated August 17, 202613 min read
A practical, repeatable framework for researching quality-growth stocks: revenue and earnings durability, profitability, cash flow, balance-sheet resilience, and valuation sanity, without treating any screen as a buy signal.
For information and education only — not investment advice or a recommendation. Do your own research. Capital at risk.
The short answer
Quality growth stocks are companies that can expand their economic footprint without destroying returns on capital or balance-sheet resilience. Finding them is less about chasing the loudest revenue percentage on a screener and more about pressure-testing earnings quality, cash conversion, and leverage before you spend serious time on valuation. A workable order is: understand the business and its growth runway, test whether profits and cash support the story, stress liquidity, then ask whether the price still makes sense versus peers and history. Timing sits in a different box.
Why this matters
Growth stories travel because they are easy to narrate: rising sales, expanding markets, product momentum. Growth without quality often disappoints. Revenue can climb while margins fall apart. Earnings can look healthy while free cash flow does not. A clean narrative can hide leverage, customer concentration, or a model that only works when capital is cheap.
The cost of skipping the framework is not only a bad week. It is weekends spent on names that never deserved a file, and entries made because the chart looked decisive while the cash statement was already arguing the other way.
Investor-education resources from Investor.gov and FINRA put the emphasis on primary disclosures rather than headlines. For listed US companies, that usually means filings on SEC EDGAR. UK readers should keep FCA InvestSmart guidance in mind: capital is at risk, and research tools do not remove that risk.
A framework slows you down in useful places. It makes you ask the same questions every time, so you are less likely to skip cash flow because the product is fashionable.
This article is a research framework. It is education and process design, not a call to buy or sell any security. For the step-by-step walkthrough of a single name, use . This piece stays at the definition layer: what quality-growth means, and which questions belong in which box.
See the product
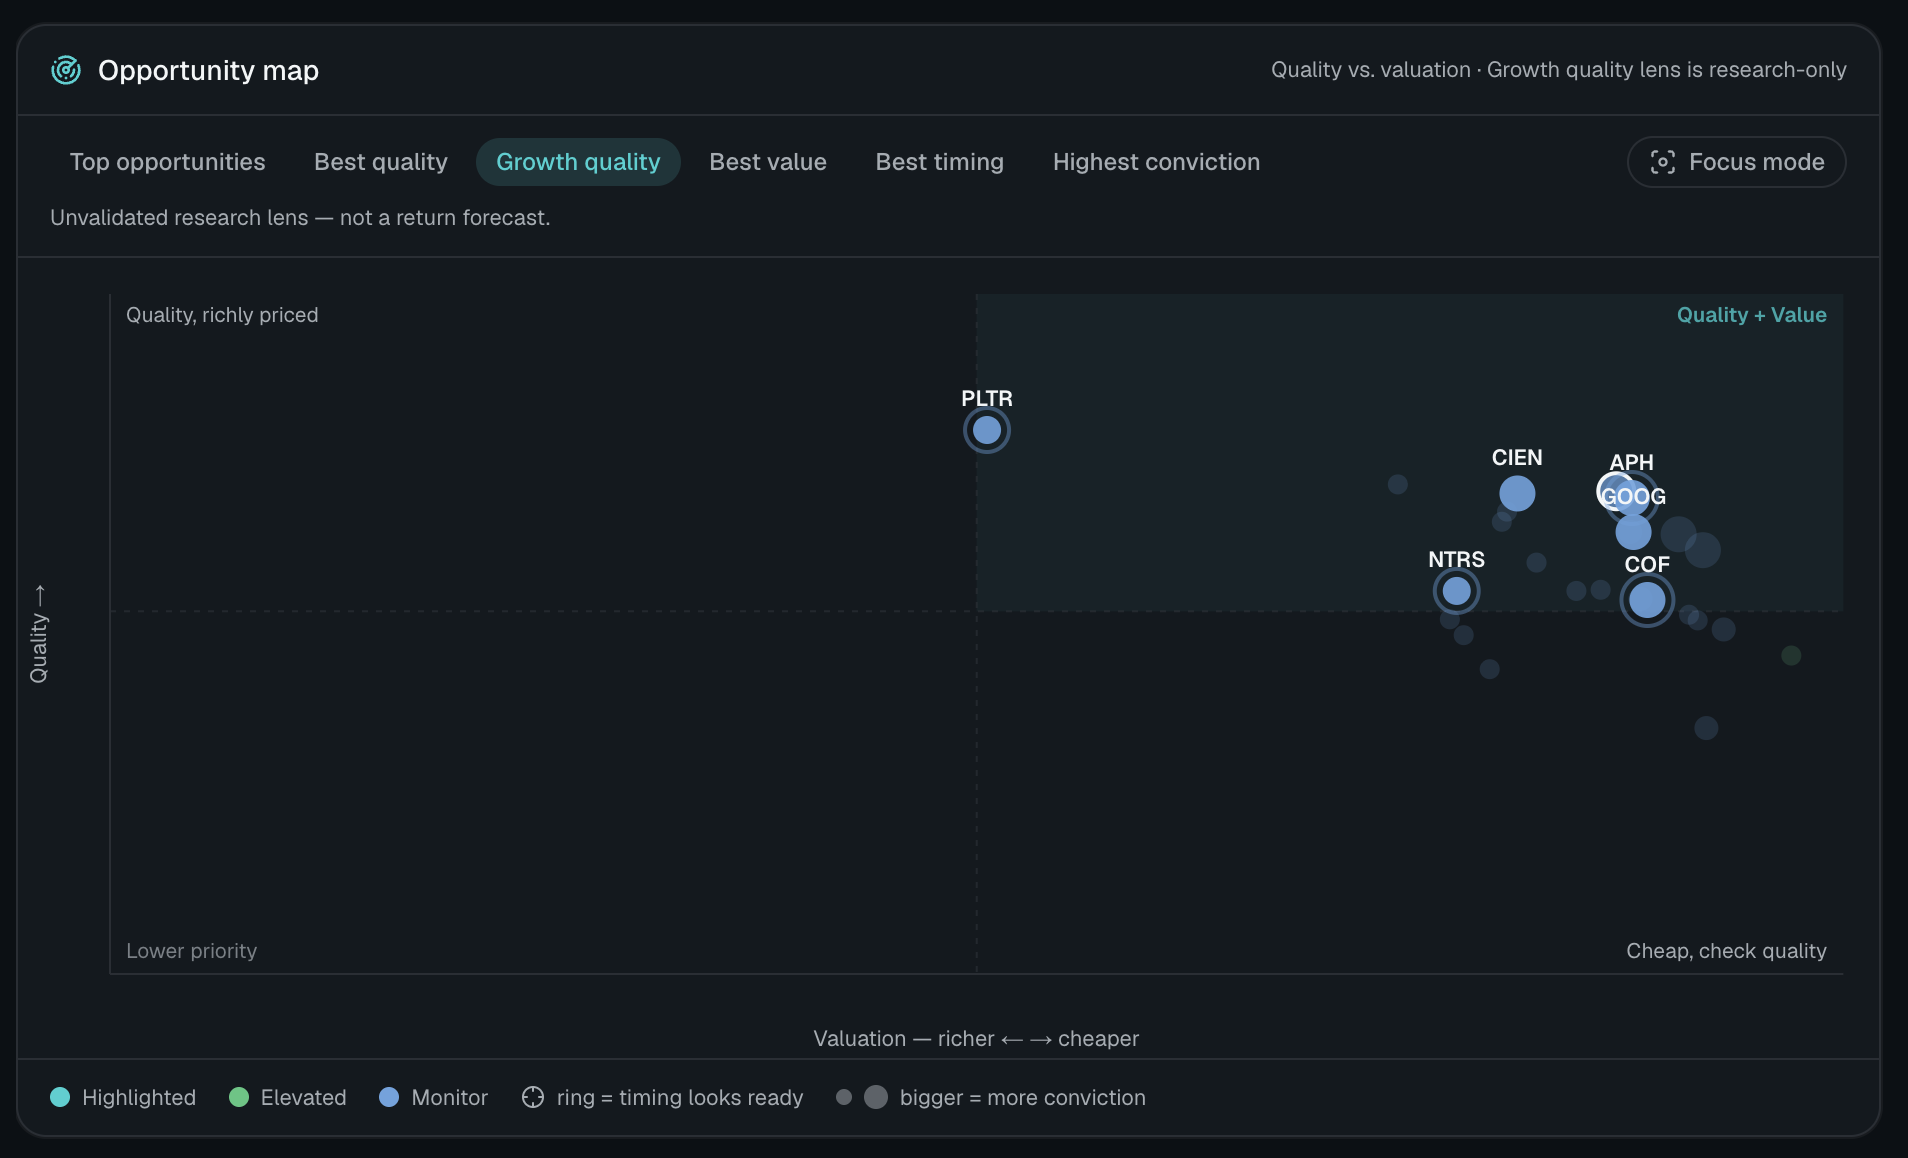
Ranked Opportunity Radar with quality, valuation, growth, timing, and conviction pillars, so research stays organised before you act.
A strong business can still be a poor entry. Learn how to separate company quality, valuation context, and technical timing, and why chasing extended quality names is a common research mistake.
A practical, repeatable process for researching a growth stock: from business quality and cash flow to valuation, timing, risks, and a thesis you can review later.
"Quality-growth" is a research label, not a formal accounting category. In practice it means a company that can grow without hollowing out the economics that make growth worth owning.
Look for a cluster of traits rather than one heroic number.
Durable demand. Growth tied to products or markets that can persist beyond a single product cycle.
Economic returns. Growth that produces acceptable margins and returns on capital, not growth purchased with endless dilution or debt.
Cash conversion. Reported profits that eventually become cash after maintenance investment.
Financial flexibility. Enough liquidity and manageable leverage to fund growth and absorb shocks.
Valuation awareness. Even a strong business can be priced for perfection. Price is a separate question from quality.
None of these traits promises future returns. They help you decide whether a name deserves deeper work, which is the right job for a research framework. A shorter reusable list lives in How to Build a Repeatable Stock Research Checklist.
Revenue growth: more than a percentage
Revenue growth answers a simple question: is the company selling more of something customers value?
Start with rate and consistency. One strong year matters less than a multi-year pattern. Sudden spikes need an explanation: acquisitions, one-off contracts, price spikes, accounting changes. Separate organic growth from acquired growth. Acquisition-driven growth can be real, but it changes the risk story. Integration, goodwill, and shifting customer mixes all matter.
Study the mix. Which segments, products, or regions drive growth? Concentrated growth is more fragile than diversified growth. Ask whether growth is price-led or volume-led. Price-led growth can reverse when competition returns. Volume-led growth needs capacity and distribution that can scale.
Customer quality matters too: retention, expansion within accounts, and concentration. A few large customers can make growth look smoother than it is.
Macro context can matter without becoming the whole thesis. Series such as those on FRED help you see whether you are studying a company against a favourable industry cycle or fighting a headwind. Cycle awareness is context, not a substitute for company analysis.
Suppose a company reports a sharp revenue jump after buying a smaller rival, while organic growth was much slower. The headline looks like quality-growth. The research question becomes whether the combined business can grow without serial acquisitions, and whether cash flow after integration costs still supports the story. That is a structure question, not a ticker call.
Earnings quality and profitability
Earnings growth asks whether revenue growth is turning into owner-relevant profit, and whether that profit is durable.
Watch margin direction: expanding, stable, or compressing? Growth with collapsing margins is a warning, not automatically a bargain. Strip out one-offs such as gains on asset sales, tax benefits, restructuring credits, and mark-to-market items. Check the share count. Earnings per share can rise because the company bought back shares or because the business improved. Both can be fine. They are different stories.
Accounting choices around revenue recognition, capitalised costs, and stock-based compensation can change the look of earnings without changing cash reality. Peer comparison helps because absolute margin levels vary by industry. Relative trend and peer positioning are often more informative than a single number in isolation.
Primary filings remain the best place to reconcile "adjusted" earnings with GAAP or IFRS results. Investor education materials repeatedly stress reading disclosures rather than relying on promotional summaries.
Growth that never earns an economic return is activity, not quality. Profitability and capital efficiency ask whether the business model works as it scales.
Areas worth systematic attention:
Gross margin and operating margin trends
Returns on invested capital or equity where those measures are meaningful for the industry
Working-capital intensity as sales grow
Incremental margins on new revenue: does the next unit of sales look healthier than the last?
Be careful with cross-sector comparisons. A software company and a retailer can both be quality-growth candidates and still have completely different acceptable margin structures. Compare like with like, and prefer multi-year patterns over a single quarter.
Cash flow: where growth stories survive or fail
Cash flow is where many growth narratives weaken. Accrual earnings can look strong while the business consumes cash to fund receivables, inventory, or heavy capital expenditure.
A practical cash-flow review compares:
Operating cash flow with net income. Persistent large gaps deserve an explanation.
Free cash flow after maintenance needs. Growth capex can be strategic. Maintenance still has to be funded.
Working capital. Rapid growth often absorbs cash.
Cash versus the accounting adjustments management emphasises.
How growth is funded: operations, equity issuance, or debt.
Cash-flow analysis is not about finding a perfect company. It is about knowing whether the growth engine is self-funding, capital-hungry, or dependent on friendly markets. That distinction changes how you read every later valuation multiple.
Balance-sheet resilience and growth durability
Quality-growth companies often reinvest aggressively. That does not excuse a fragile balance sheet.
Check cash and liquidity against near-term obligations, the debt maturity profile and covenants where disclosed, interest coverage if leverage is material, off-balance-sheet or contingent exposures discussed in filings, and dilution history plus remaining capacity for equity issuance.
Resilience matters most when growth slows. A leveraged growth story can look elegant in an expansion phase and brittle in a downturn. The point of the check is not to demand a fortress balance sheet in every case. It is to understand how much adversity the company can absorb without rewriting the equity story.
Durability is the bridge between "grew recently" and "might keep compounding."
Ask whether demand is driven by a structural shift, a temporary shortage, or a fashion cycle. How easily can competitors copy the product, price, or distribution advantage? Does regulation help, hinder, or leave the model exposed to sudden rule changes? What would have to stay true for the next several years of growth to remain plausible? How dependent is the thesis on one product, one geography, or one customer cohort?
Durability is qualitative by nature. That is fine. Write the assumptions down. If you cannot state what would falsify the growth story, you do not yet have a researchable thesis.
A quality-growth framework is incomplete without a deterioration checklist. Watch for revenue growth that stays high while incremental margins fall sharply; receivables or inventory growing much faster than sales; rising leverage used to defend the growth narrative; customer concentration increasing as growth "succeeds"; guidance that repeatedly resets lower without a clear new plan; competitive pricing pressure that management dismisses as temporary for too long; and capital raises that fund operating shortfalls rather than discrete expansion projects.
Deterioration does not always mean "sell tomorrow." It means the research priority should change. You may need more evidence, a smaller place in your own plan, or simply more patience before adding attention.
Valuation sanity, not a price target
Valuation does not decide whether a business is high quality. It decides whether the market's price leaves room for a sensible research priority.
Keep valuation sanity checks modest and comparative:
Multiples versus the company's own history, where the business model is stable enough for history to matter
Multiples versus relevant peers
Growth-adjusted context, for example relating earnings multiples to expected growth, with all the usual caveats
Cash-flow yields where free cash flow is meaningful
Scenario thinking about what has to go right for today's price to look reasonable in hindsight
Avoid turning a single ratio into a verdict. CFA Institute materials on equity valuation stress that multiples are starting points that need context: growth, risk, accounting, and capital structure. For a metric-by-metric explainer, see P/E, PEG and EV/EBITDA.
This article does not label any stock as a buy, a bargain, or an immediate opportunity. Valuation sanity means you understand what you are paying for. It is not a signal to act.
Timing is a separate question
Business quality and entry timing are different problems. A durable growth company can become crowded, extended, or misaligned with the higher-timeframe trend. Chasing that extension is a common way to turn a good research idea into a painful experience.
Finish the quality-growth work first. Then ask whether price structure supports attention now, later, or not yet. Great Company, Bad Entry is the companion piece for that split. The short version for this framework: a strong quality-growth name can still be a poor entry.
Common mistakes
Treating the loudest growth rate as the thesis. A headline percentage is a starting clue. It is not evidence that growth is durable, funded, or economically useful.
Skipping cash flow because earnings look clean. Accrual profit can run ahead of cash for a long time. The gap is the research object.
Comparing margins across unlike businesses. A "good" margin in one industry is a warning in another. Peer set first, then judgement.
Using valuation language as a quality stamp. A lower multiple does not make the business higher quality. A higher multiple does not make the business worse. They are different questions.
Letting a strong chart finish the quality work. Momentum is not cash conversion. Extension is not durability.
Treating a checklist pass as understanding. Passing your own list means the name survived a first filter. It does not mean you understand the business.
Confusing research priority with a decision to act. A name can deserve a file and still deserve patience.
How PRISM helps
PRISM is a research workspace for self-directed investors. In the product you navigate opportunities through four research lenses: Quality, Valuation, Timing, and Conviction. Those lenses organise work. They are not a validated predictive ranking.
For quality-growth work, the Quality lens helps you prioritise names where profitability, growth durability, earnings reliability, cash generation, and balance-sheet resilience deserve a closer look. The Valuation lens keeps price discipline visible as its own question, separate from "is the business strong?" The Timing lens reminds you that a strong quality-growth story can still be poorly timed. Model status on the timeframes PRISM currently generates (Long-term weekly and Position daily) is research context, not a broker order.
The Conviction lens adds inspectable context from longer-term holder filings where available. It does not currently drive the ranked Score. Do not read holder presence as a ranking engine or a copy-trade instruction.
The PRISM Score is a 0-100 research-priority model score. Use it to decide where to dig next, not as a forecast of returns. Rating bands (Highlighted, Elevated, Monitor, Weak setup, Low score) are scanning aids. A given band can be sparsely populated depending on current scores. PRISM does not publish those weights.
PRISM does not replace filings, your judgement, or regulated advice. It is an information and education workspace: rank, inspect, compare lenses, keep notes, and monitor how a thesis changes.
Use this as a repeatable pass. Answer in writing. Ambiguous answers are useful; they tell you what to research next.
Business and growth
What does the company sell, and to whom?
What is the multi-year revenue growth pattern, not only the latest quarter?
How much growth is organic versus acquired?
Where is concentration risk (customer, product, geography)?
What would falsify the growth durability story?
Earnings and profitability
Are margins expanding, stable, or compressing, and why?
How much of earnings growth is operational versus one-offs or buybacks?
Do peer comparisons support or challenge the profitability story?
Cash flow
Does operating cash flow support reported earnings over time?
Is free cash flow positive, improving, or structurally negative during investment phases?
How is growth funded?
Balance sheet
Is liquidity adequate for the next stress period you can reasonably imagine?
Is leverage manageable against cash generation?
What dilution or refinancing risk exists?
Valuation sanity
What are you paying relative to history and peers?
What growth and margin path is implied by today's price, qualitatively?
Which risks are you underpaying or overpaying attention to?
Process
Is this a research priority, a watchlist candidate, or a pass for now?
Have you separated "good business" from "good entry"?
Have you read primary disclosures, not only secondary summaries?
Limitations
No framework removes market risk. Prices can fall even when your research process was careful. Accounting is imperfect; reported numbers require judgement, and different industries need different emphasis. Forward growth is uncertain; durability checks reduce blind spots, they do not produce certainty. Screens create false comfort; passing a checklist is not the same as understanding a business.
Illustrative patterns in this article are for teaching structure only. They are not tips and include no fabricated company metrics. PRISM outputs are research context. A higher score or a favourable lens mix is not a recommendation, a suitability assessment, or advice tailored to you. Coverage, filing delays, and model assumptions all matter. See the public methodology page for how the product currently frames scores, lenses, and limits.
UK and international readers: PRISM is a research and education product, not FCA-authorised investment advice. Always do your own research before making investment decisions.
Risk disclosure
Shares can fall in value and you may lose the money you invest. Company results, research rankings, and model statuses from the past do not tell you what will happen next. This article is educational research material. It is not tailored to your circumstances, and it is not an invitation to buy or sell any security.
Think about your own objectives, time horizon, and tolerance for loss before you act on any idea. If you are unsure, speak with an appropriately authorised adviser. Read PRISM's risk disclosure.
Sources and methodology
Primary education and disclosure sources cited above include SEC EDGAR company filings, Investor.gov and FINRA guidance on researching investments, FCA InvestSmart, CFA Institute equity valuation materials, and FRED series for cycle context. Filings and vendor-normalised fundamentals can lag, restate, or omit fields; treat any screen or score as provisional until you have checked as-of dates on names that matter to you.
PRISM framing in this article follows the public methodology: research lenses as a navigation frame, Score as a 0-100 research-priority model score, Conviction as inspectable holder-filing context that does not currently drive the ranked Score, Setup timing as a separate layer on the timeframes PRISM currently generates, no internal weight percentages, and no public Track Record claim.