A practical, repeatable process for researching a growth stock: from business quality and cash flow to valuation, timing, risks, and a thesis you can review later.
For information and education only — not investment advice or a recommendation. Do your own research. Capital at risk.
The short answer
Analyse a growth stock as a fixed session, not as a pile of open tabs. Write the question this sitting must answer, map the business in plain language, test whether growth is real and durable, then pressure-test margins, cash conversion, and funding. Only after that should you place valuation in context and judge timing separately from quality. Finish with risks, an invalidation line, and a dated thesis you can revise. You are building a research record, not hunting for certainty.
Why this matters
Growth stories pull attention. Revenue can climb while the economics stay thin. A chart can look decisive while the price already assumes years of clean execution. Without an order of operations, research turns into half-finished notes and confirmation bias.
Investor.gov and FINRA keep coming back to the same habits: know what you own, how it makes money, and what could go wrong. A repeatable process is how those habits show up in a normal week.
A practical, repeatable framework for researching quality-growth stocks: revenue and earnings durability, profitability, cash flow, balance-sheet resilience, and valuation sanity, without treating any screen as a buy signal.
A clear guide to P/E, forward P/E, PEG, EV/EBITDA and free-cash-flow yield: what each measures, when each fails, and how to compare companies without treating one ratio as a verdict.
For information and education only — not investment advice. Capital at risk. How PRISM works · Risk disclosure · Methodology methodology-2026-08
Are margins improving as the company scales, or is growth buying revenue at the expense of economics?
Is the current price asking you to pay for perfect execution?
Is timing constructive on the Long-term (weekly) and Position (daily) charts, or should you wait?
Write the objective in one sentence. If you cannot state it, you are browsing.
Also define your horizon. Multi-year holders emphasise durability, reinvestment, and competitive position. Position research still needs those foundations, then adds stricter attention to trend integrity and extension. Mixing horizons mid-session is a common way to talk yourself into a chase.
Then write the business model in plain language:
Who pays the company, and for what?
Is revenue recurring, project-based, cyclical, or dependent on a few large customers?
What must remain true for growth to continue?
Who are the main competitors, and what stops a customer switching?
Primary sources beat summary sites here. For US-listed companies, use SEC EDGAR for the latest annual report (10-K), quarterly report (10-Q), and material events (8-K). Structured XBRL facts are available through the SEC Company Facts interface when you want reported line items without leaning on a secondary aggregator.
Industry context matters because growth rates are not portable. A software company compounding revenue at a high rate is not comparable to a retailer expanding store count, even if both get labelled "growth." Note capital intensity, regulation, customer concentration, and sensitivity to rates or commodity prices. Macro series from FRED can frame the backdrop. They do not replace company-level work.
UK readers researching overseas listings should still apply local investor-protection habits from the FCA Investors hub: check the issuer, understand product risk, and stay sceptical of promotional framing.
Test whether growth is real
Growth analysis starts with the top line. It should not end there.
Revenue quality
Look across several periods, not a single quarter:
Is growth accelerating, stable, or decelerating?
How much comes from volume, price, mix, acquisitions, or currency?
Are one-time items inflating the story?
Does management disclose segment growth that contradicts the headline?
Acquisitive growth can be real and still change the risk profile. Organic growth with rising retention usually tells a cleaner story than growth that only appears after serial deal-making.
Earnings growth
Read earnings beside revenue:
Are earnings growing faster, slower, or more erratically than sales?
Are non-GAAP adjustments large relative to reported results?
Do estimate revisions and guidance point to strengthening or softening demand?
A company can grow revenue while earnings stall if costs, dilution, or mix work against owners. The reverse can happen too: earnings may look strong while revenue flattens, which can mean cost-cutting rather than durable expansion. Neither pattern is automatically good or bad. Both need an explanation.
Professional research frameworks from the CFA Institute treat growth as something to decompose, not celebrate. Do the same.
Pressure-test economics and funding
Growth that never reaches workable economics is often just activity.
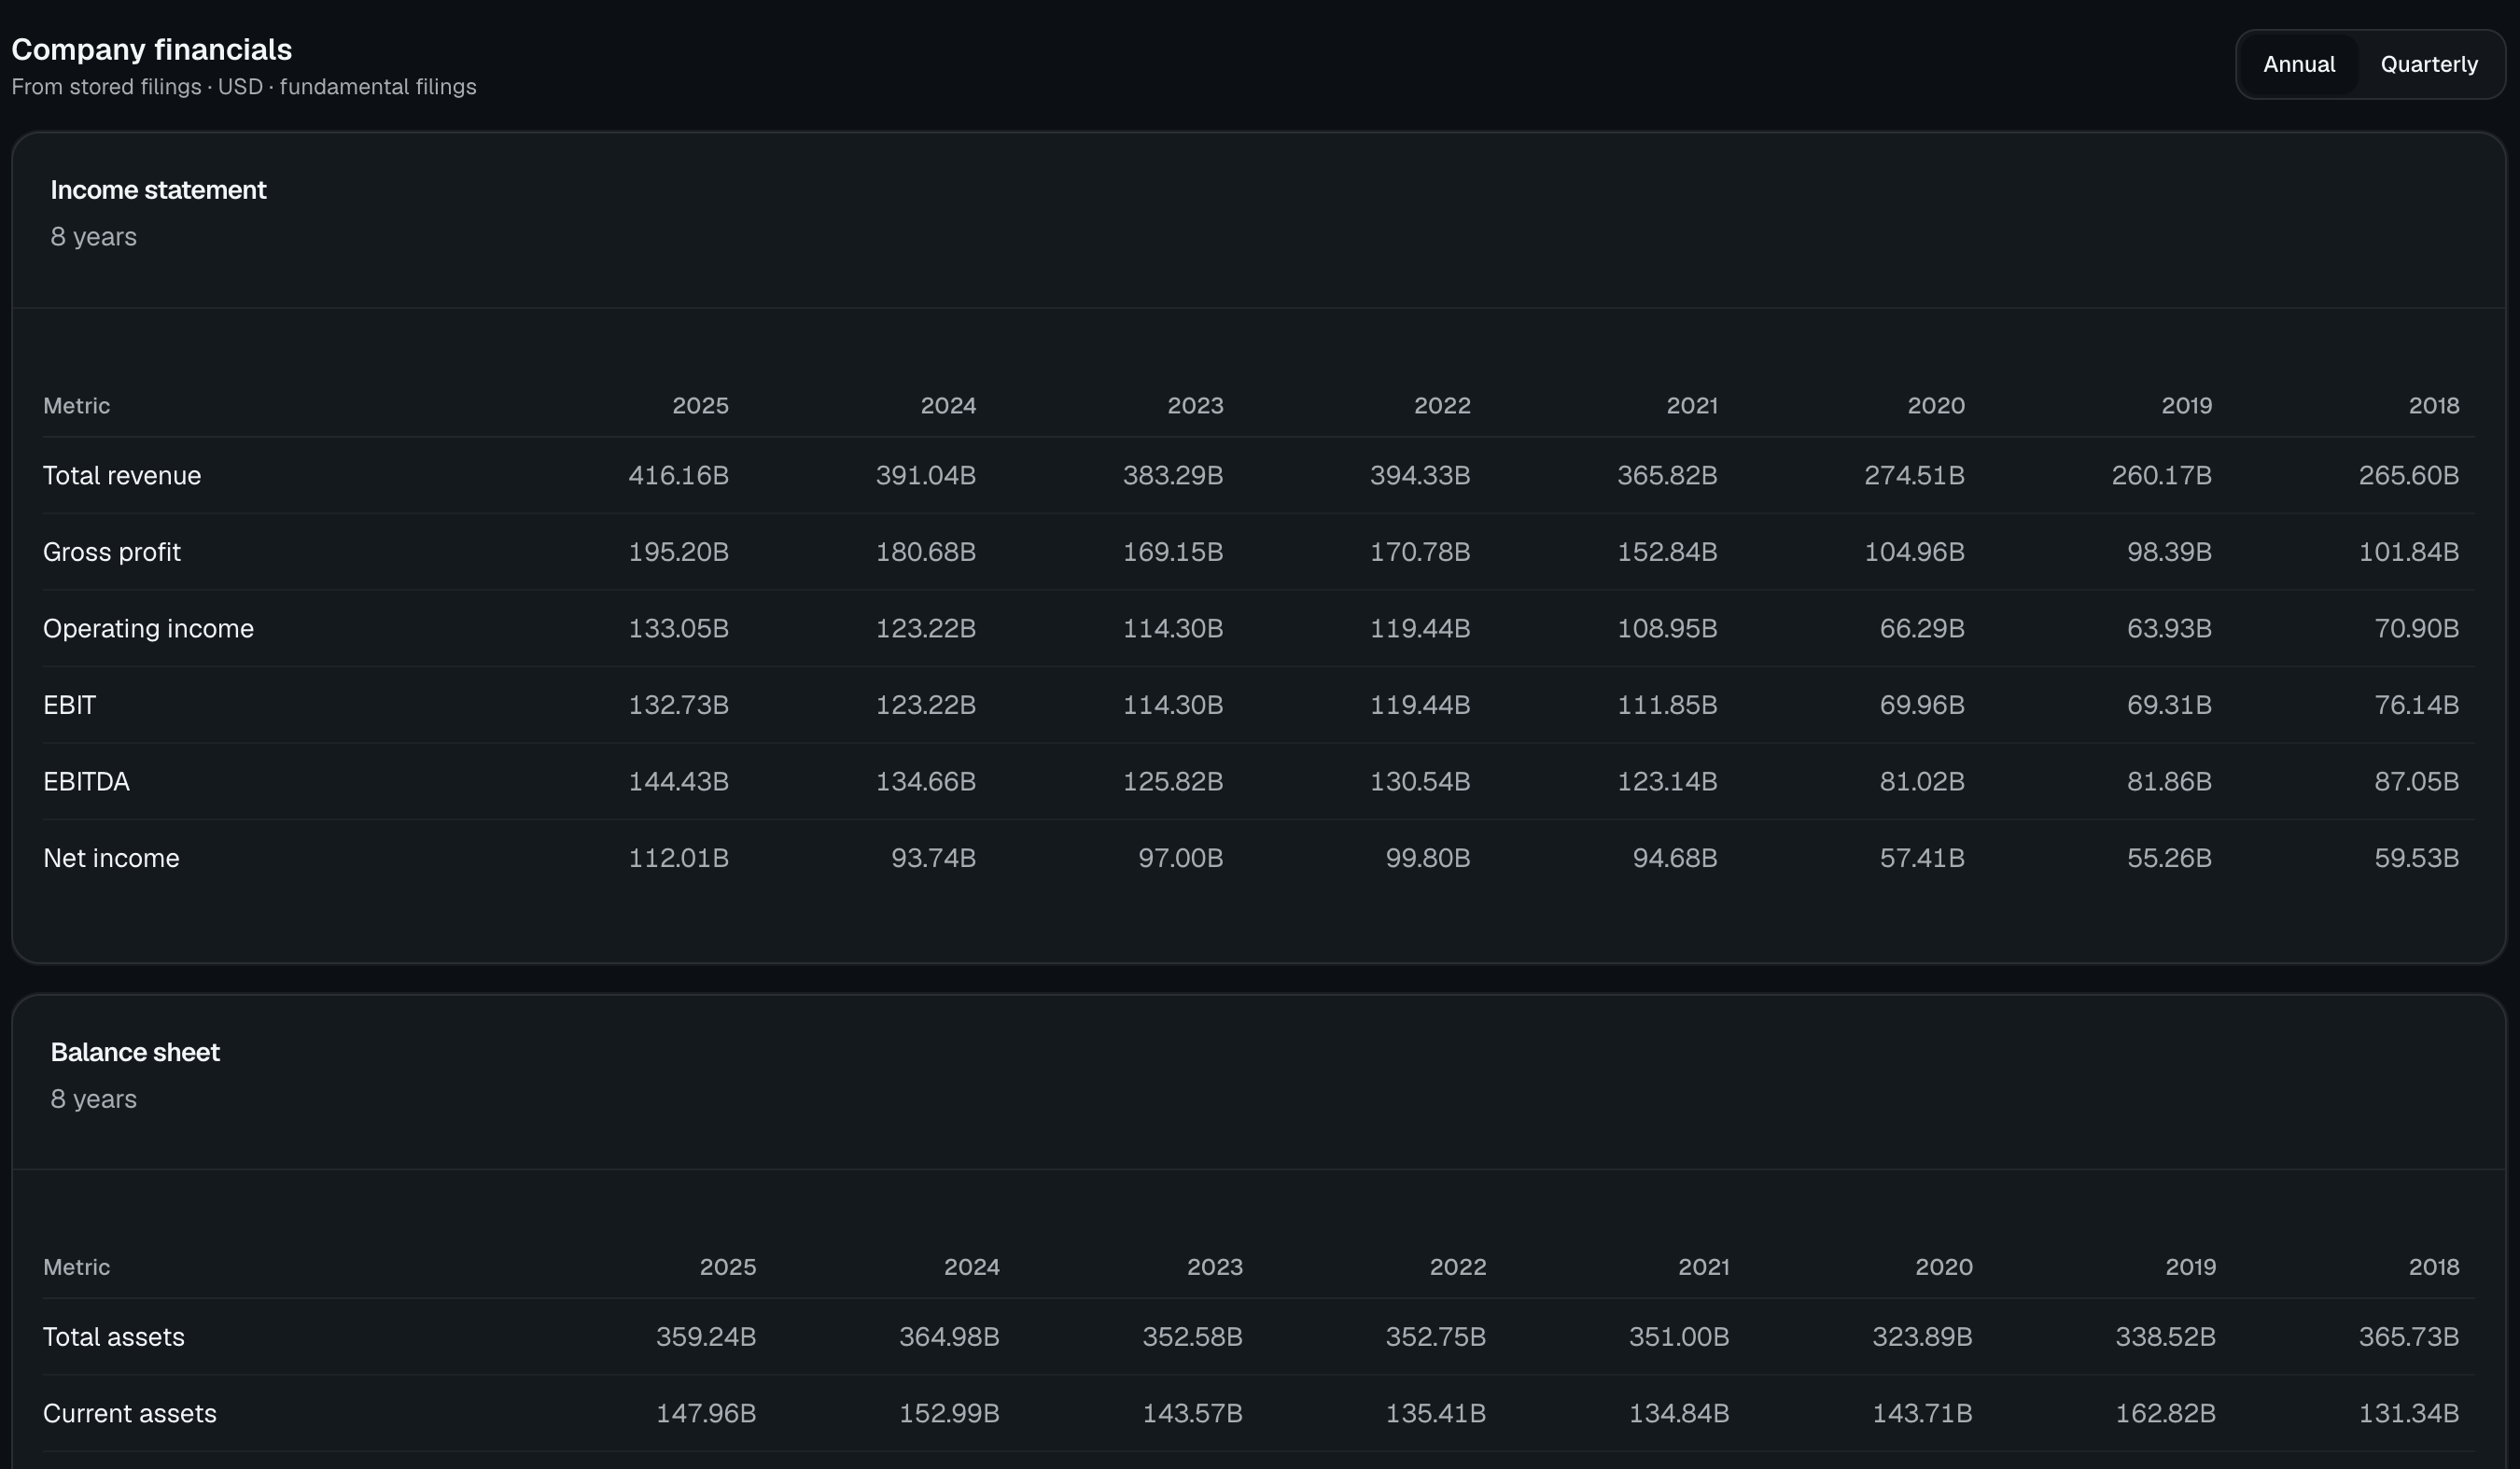
Study gross margin trend, operating margin trend, whether incremental revenue appears to carry incremental profit, and expense lines that scale faster than sales. Improving margins with growth can support a quality thesis. Flat or falling margins during rapid expansion raise a harder question: is the company buying growth with discounts, heavier sales spend, or an unfavourable mix?
Be careful with early-stage reinvestment. Some businesses intentionally run lower near-term margins to capture a market. That can be rational. It still needs a clear path to cash generation and a funding plan that does not rely on perfect capital markets forever.
Reported earnings are an accounting view. Cash flow is where many growth stories get stress-tested.
Does operating cash flow track or exceed net income over time?
Is free cash flow positive, approaching positive, or persistently negative?
How much cash is absorbed by working capital as the company grows?
Are capital expenditures maintenance-like, growth-oriented, or both?
Strong growth with weak cash conversion can still fit some models, but it changes the risk. The business may need external capital, and dilution or leverage then becomes part of the thesis.
If you use market-data vendors for calculated ratios, keep the filing as the source of truth for contested numbers. Normalised feeds can still differ from the issuer's preferred presentation.
Growth companies fail for many reasons. Running out of room to fund the plan is one of them. Review cash and short-term investments, debt maturity and covenants where disclosed, interest coverage if the company is levered, share-count trend and equity issuance history, and off-balance-sheet commitments that matter to the story.
A fortress balance sheet does not make a weak product valuable. A fragile balance sheet can make an otherwise promising growth story fragile. Your notes should say whether the company can fund its plan through a slower year without emergency dilution.
Place valuation in context
Valuation answers a different question from quality: even if the business is strong, what is the market already assuming?
Useful growth-stock tools include earnings multiples, growth-adjusted ratios, enterprise-value multiples, and free-cash-flow yield. None of them is a complete answer alone. For a dedicated walkthrough of the common ratios, see P/E, PEG and EV/EBITDA explained.
Practical rules for this step:
Compare within a sensible peer set, not against the entire market.
Separate "demanding versus history" from "demanding versus growth durability."
Ask what has to go right for today's price to make sense.
Do not treat a single low multiple as a reason to own a weak business.
Valuation research is comparative and uncertain. It is not a label that a stock is cheap enough to buy.
Judge timing separately from quality
Business quality and entry timing are different jobs. A durable grower can still be a poor place to deploy capital if price has run far ahead of a constructive setup.
On the timeframes PRISM currently generates, timing research focuses on Long-term (weekly) and Position (daily) context. Useful checks include:
Is the broader trend intact or damaged?
Is price extended relative to widely used moving averages?
Does momentum look supportive or stretched?
Are you looking at a constructive pullback, a move with confirmation, or a chase after a vertical move?
Setup states in PRISM use the lexicon Emerging, Favourable, and Monitoring, plus later outcomes such as Target reached, Stop reached, Expired, Unfavourable, and Invalidated. Those labels describe model status under published rules. They are not instructions to open or close a position.
If the business looks strong but timing looks impatient, the disciplined outcome is often "watch and wait," not "force an entry."
Write risks, holder context, and a thesis you can review
Public 13F-style holdings can add an independent context layer: who owns the name, whether positions were initiated or trimmed, and how large the holding is relative to a manager's portfolio. This is context, not a copy-trading shortcut.
Limitations matter. Filings are delayed. Managers can change their minds after the reporting date. A well-known name owning a stock does not validate your thesis. Crowded ownership can cut both ways. Use institutional context after you understand the business, not instead of that work.
Every growth thesis needs a written risk section. At minimum:
Demand risk: what if growth slows?
Competition risk: what if pricing power fades?
Execution risk: what if margins never arrive?
Funding risk: what if capital becomes expensive?
Valuation risk: what if the market compresses the multiple even if the business keeps growing?
Governance and disclosure risk: are incentives and reporting quality acceptable?
Then write the invalidation line: the evidence that would make you abandon or sharply revise the thesis. Without that line, later price declines become emotional rather than analytical.
Position sizing is personal and depends on your circumstances. Education from Investor.gov and the FCA repeatedly stresses that investing involves loss of capital and that no process removes that risk. A research process should make risks visible. It does not make them disappear.
A thesis journal turns analysis into something you can audit. A simple template:
One-sentence business description
Why growth can persist
What the economics look like today
Cash and balance-sheet constraints
Valuation assumptions in plain English
Timing notes (Long-term / Position)
Key risks and invalidation triggers
What would make you more constructive
Date of next review
Update the journal when filings land, when guidance changes, or when the chart structure breaks. The point is not perfect prediction. The point is to notice when your original reasons no longer hold.
Common mistakes
Starting the session without a written objective, then calling browsing "research"
Treating one strong quarter as a growth franchise
Skipping cash conversion because earnings look clean
Using a low multiple to rescue a business you have not understood
Collapsing quality and timing into one emotional conclusion
Copying delayed holder filings as if they completed the work
Leaving risks and invalidation unwritten, then treating a later drawdown as a surprise
Treating a completed checklist as proof rather than as a record of questions asked
How PRISM helps
PRISM is a research workspace for self-directed investors, not a broker or advice engine. In practice, that means you can start from ranked research candidates instead of a blank screener, inspect quality, valuation, timing, and conviction as separate research lenses, and open an instrument view that keeps fundamentals, valuation context, and technical state in one place.
Those lenses organise evidence. They are a navigation frame, not a validated predictive ranking. Conviction is unranked: holder context you can inspect, not an input that drives the Score. The PRISM Score (0-100) is a research-priority model score. Rating bands (Highlighted, Elevated, Monitor, Weak setup, Low score) are scanning aids; a given band can be sparsely populated.
You can also track model setup states such as Emerging, Favourable, and Monitoring on the timeframes PRISM currently generates (Long-term weekly and Position daily), and keep notes as the thesis evolves. Those statuses are classifications, not orders.
PRISM can shorten the time from "interesting ticker" to "structured first pass." It does not replace reading filings, understanding the product, or accepting that losses are part of investing.
Revenue growth quality is understood across multiple periods
Earnings growth is reconciled with revenue and adjustments
Margin trend supports or challenges the growth story
Cash conversion has been checked against earnings
Balance-sheet funding risk is explicit
Valuation is compared with peers and growth assumptions, not treated as a single verdict
Timing is assessed separately from quality
Institutional context is noted with filing lag in mind
Risks and invalidation triggers are written down
Next review date is set
If several boxes remain empty, the honest status is "research incomplete," not "opportunity confirmed."
Limitations
This sequence has clear limits. Public filings can be incomplete, restated later, or hard to compare across companies. Normalised ratios from any data vendor can differ from company-reported presentations. Growth durability is uncertain by nature. Technical timing can look constructive and still fail. Institutional holdings are lagged and partial. A clean checklist can create false confidence if you treat completion as proof.
No research sequence can identify a sure outcome. The value is better questions, clearer notes, and fewer impulsive decisions. Read the public methodology for how PRISM presents research context, rating bands, and timing labels. This article does not present a public Track Record.
Risk disclosure
This material is for information and education only. PRISM is not a broker, investment advisor, or execution venue, and nothing here is a recommendation to buy, sell, or hold any security. Capital is at risk when you invest, and past performance or model behaviour is not a reliable guide to future results. Do your own research, and consider independent financial advice if you need it. Full details are in the risk disclosure and methodology.
Sources and methodology
Framing follows the public methodology: Score as a 0-100 research-priority model score; four research lenses as a navigation frame rather than a predictive ranking; Conviction as inspectable context that does not drive the ranked Score; Setup statuses as model classifications on the timeframes PRISM currently generates; no internal lens-weight percentages; no public Track Record claims here. Primary sources include SEC EDGAR, SEC Company Facts, Investor.gov, FINRA, the FCA Investors hub, CFA Institute research materials, and FRED. Citations appear at the point of use above. Examples are illustrative process guidance only.