P/E, PEG and EV/EBITDA: Which Valuation Metric Should You Use?
PRISM EditorialUpdated August 17, 202610 min read
A clear guide to P/E, forward P/E, PEG, EV/EBITDA and free-cash-flow yield: what each measures, when each fails, and how to compare companies without treating one ratio as a verdict.
For information and education only — not investment advice or a recommendation. Do your own research. Capital at risk.
The short answer
Match the valuation lens to the business, and use more than one. P/E is a quick earnings multiple. Forward P/E shifts the denominator to expected earnings. PEG tries to adjust an earnings multiple for growth. EV/EBITDA compares enterprise value with operating earnings before interest, tax, depreciation and amortisation. Free-cash-flow yield asks what cash generation you are getting for the price. None of these ratios, alone, tells you whether a stock deserves capital. They are comparative tools, not verdicts.
Why this matters
Valuation debates often sound like math arguments. They are usually definition arguments.
Two investors can look at the same company and disagree because they are using different earnings definitions, different growth assumptions, different capital structures, or different peer sets. That is why professional materials from the CFA Institute treat valuation as choosing models, checking inputs, and stating limitations, not hunting for one magic number.
Retail education from Investor.gov and FINRA pushes the same discipline: understand what a metric claims to measure before you lean on it.
A practical research sequence for combining business fundamentals, valuation context, and technical timing, without mechanically averaging signals or treating any lens as a buy recommendation.
A practical, repeatable process for researching a growth stock: from business quality and cash flow to valuation, timing, risks, and a thesis you can review later.
For information and education only — not investment advice. Capital at risk. How PRISM works · Risk disclosure · Methodology methodology-2026-08
P/E ratio
The price-to-earnings ratio divides share price by earnings per share. In plain terms: how many pounds or dollars of market price are attached to one unit of reported earnings.
A common trailing version uses the last twelve months of earnings. Exact implementations differ by data provider, especially around diluted shares, extraordinary items, and fiscal versus calendar windows.
P/E is useful for fast comparison among profitable peers with similar accounting, for tracking whether a company's multiple has expanded or compressed versus its own history, and for framing the market's earnings expectations at a high level.
It fails where the denominator is weak. Losses make the ratio meaningless or misleading. Cyclical earnings can make a low multiple look like a bargain at the top of a cycle. Accounting choices and one-offs distort the denominator. Capital structure differences are not visible in a pure equity multiple. High-reinvestment businesses may show modest near-term earnings while still creating value later, or destroying it.
A lower P/E is not automatically a reason to own the name. A higher P/E is not automatically reckless. Both need a story about earnings quality and durability.
Forward P/E
Forward P/E replaces trailing earnings with expected earnings, often over the next twelve months or the next fiscal year. The numerator is still price; the denominator becomes a forecast.
It is useful when recent earnings were distorted by a temporary event, when you want to ask whether today's price requires ambitious earnings delivery, and when you are cross-checking whether the market is already pricing a recovery or a slowdown.
It fails because forecasts can be wrong, stale, or overly optimistic. Different sources use different estimate consensus methods. Guidance changes can move the ratio without the business changing overnight. Using forward earnings can hide a weak current franchise behind hopeful projections.
Forward multiples shift uncertainty into the denominator. That can be useful, but it is still an assumption stack. Always ask: whose forecast, as of when, and what happens if delivery slips?
PEG ratio
PEG commonly divides a P/E ratio by an expected earnings growth rate. The intuition is simple: a higher multiple may be more acceptable if growth is higher.
A widely used educational form is:
PEG ≈ P/E ÷ expected earnings growth rate
Implementations vary. Some use trailing P/E, some use forward P/E, and growth rates may be expressed as whole numbers rather than decimals. Always check the formula before comparing PEG values across tools.
PEG is useful for putting growth and multiple in the same conversation, for screening names where the earnings multiple looks disconnected from stated growth assumptions, and for forcing an explicit growth input instead of staring at P/E alone.
It fails in familiar ways. Growth estimates are uncertain and often too smooth. PEG assumes a linear trade-off that real businesses do not obey. It can flatter low-quality growth if the growth rate is inflated. It struggles when earnings are near zero, negative, or highly volatile. It ignores balance-sheet risk, cash conversion, and competitive durability.
PEG is a conversation starter about growth-adjusted earnings valuation. It is not a complete valuation model, and it should not be treated as a signal that a stock is a bargain.
EV/EBITDA
Enterprise value (EV) typically starts with equity market value, then adjusts for net debt and other claims so you are looking at the value of the operating business. EBITDA is earnings before interest, tax, depreciation and amortisation: a rough operating earnings proxy.
EV/EBITDA therefore asks: how many times enterprise value stands relative to that operating earnings proxy.
It is useful for comparing firms with different leverage, looking across capital-intensive peers where depreciation policies differ, studying whole-firm valuation context, and situations where interest expense makes equity earnings harder to compare.
It fails because EBITDA is not cash flow. It ignores capital expenditure, working capital, and stock-based compensation realities. Heavy maintenance-capex businesses can look cheaper on EV/EBITDA than they are in cash terms. Definition differences in leases, adjustments, and "adjusted EBITDA" can wreck peer comparisons. It is a weak fit for banks and many financials where enterprise-value logic is different. Growing companies can show rising EBITDA while free cash flow remains weak.
EV/EBITDA is often more informative than a naive equity multiple when leverage differs. It still needs cash-flow follow-through.
Free-cash-flow yield
Free-cash-flow (FCF) yield typically compares free cash flow with enterprise value or market capitalisation, depending on the convention used. Conceptually it asks: for the price of the business or equity, how much discretionary cash is being generated?
A higher yield means more cash generation relative to price, all else equal. All else is rarely equal.
FCF yield is useful for checking whether earnings translate into cash, stress-testing growth stories that look fine on P/E but consume cash, comparing mature cash generators within a sector, and making capital-return capacity more visible.
It fails when growth businesses intentionally run low or negative FCF while reinvesting, when one-year FCF is lumpy because of working capital or project timing, when definitions of free cash flow differ across filings and data vendors, and when yield looks high because the market expects cash flows to fall.
FCF yield is often one of the more honest valuation companions for owners who care about cash. It is still not a verdict by itself.
Why metrics travel poorly across sectors
Valuation metrics do not travel cleanly across industries.
Business type
Often more useful
Often less useful alone
Profitable software / asset-light growth
Growth-aware earnings multiples, FCF trajectory
Raw trailing P/E without growth context
Capital-intensive industrials
EV/EBITDA plus FCF after maintenance capex
EBITDA without a capex discussion
Early-stage growers with losses
Revenue quality, path to cash, balance-sheet runway
Classic P/E or PEG
Financials
Sector-specific equity and book measures
Standard EV/EBITDA
Cyclicals
Normalised earnings and cycle position
Trailing multiples at peak earnings
Macro conditions also matter. Rate regimes and risk appetite can compress or expand multiples across a market. Series on FRED can help you see the backdrop, but they do not tell you the fair multiple for one company.
Primary filings on SEC EDGAR and structured facts via SEC Company Facts remain the place to resolve contested inputs. Vendor ratios are convenient; filings are authoritative when definitions disagree. Normalised feeds can still differ from the issuer's preferred non-GAAP presentation.
A comparison routine that stays comparative
A practical comparison routine:
State the business model in one sentence.
Choose two or three metrics that fit that model.
Build a peer set that actually competes for the same economics.
Compare level and trend: current multiple, history, and peer range.
Write the assumption: what growth, margins, and cash conversion does the price appear to require?
Separate valuation discomfort from business-quality discomfort.
Only then ask whether timing makes patience or urgency more rational.
This is investigation, not a call that a security is mispriced. UK readers should also keep FCA investor guidance in mind: financial promotions and tool marketing must stay fair, clear, and not misleading. The same standard is useful for your own notes.
Common mistakes
Treating a lower P/E as a reason to own a business you have not understood
Using forward earnings as if they were facts
Comparing PEG values across tools without checking the formula
Celebrating EV/EBITDA while free cash flow deteriorates
Matching a high-growth niche firm with a mature conglomerate and calling it a peer set
Ignoring cycle position so peak earnings look "normal"
Letting one ratio end the research
Skipping filings because a vendor already printed a tidy multiple
How PRISM helps
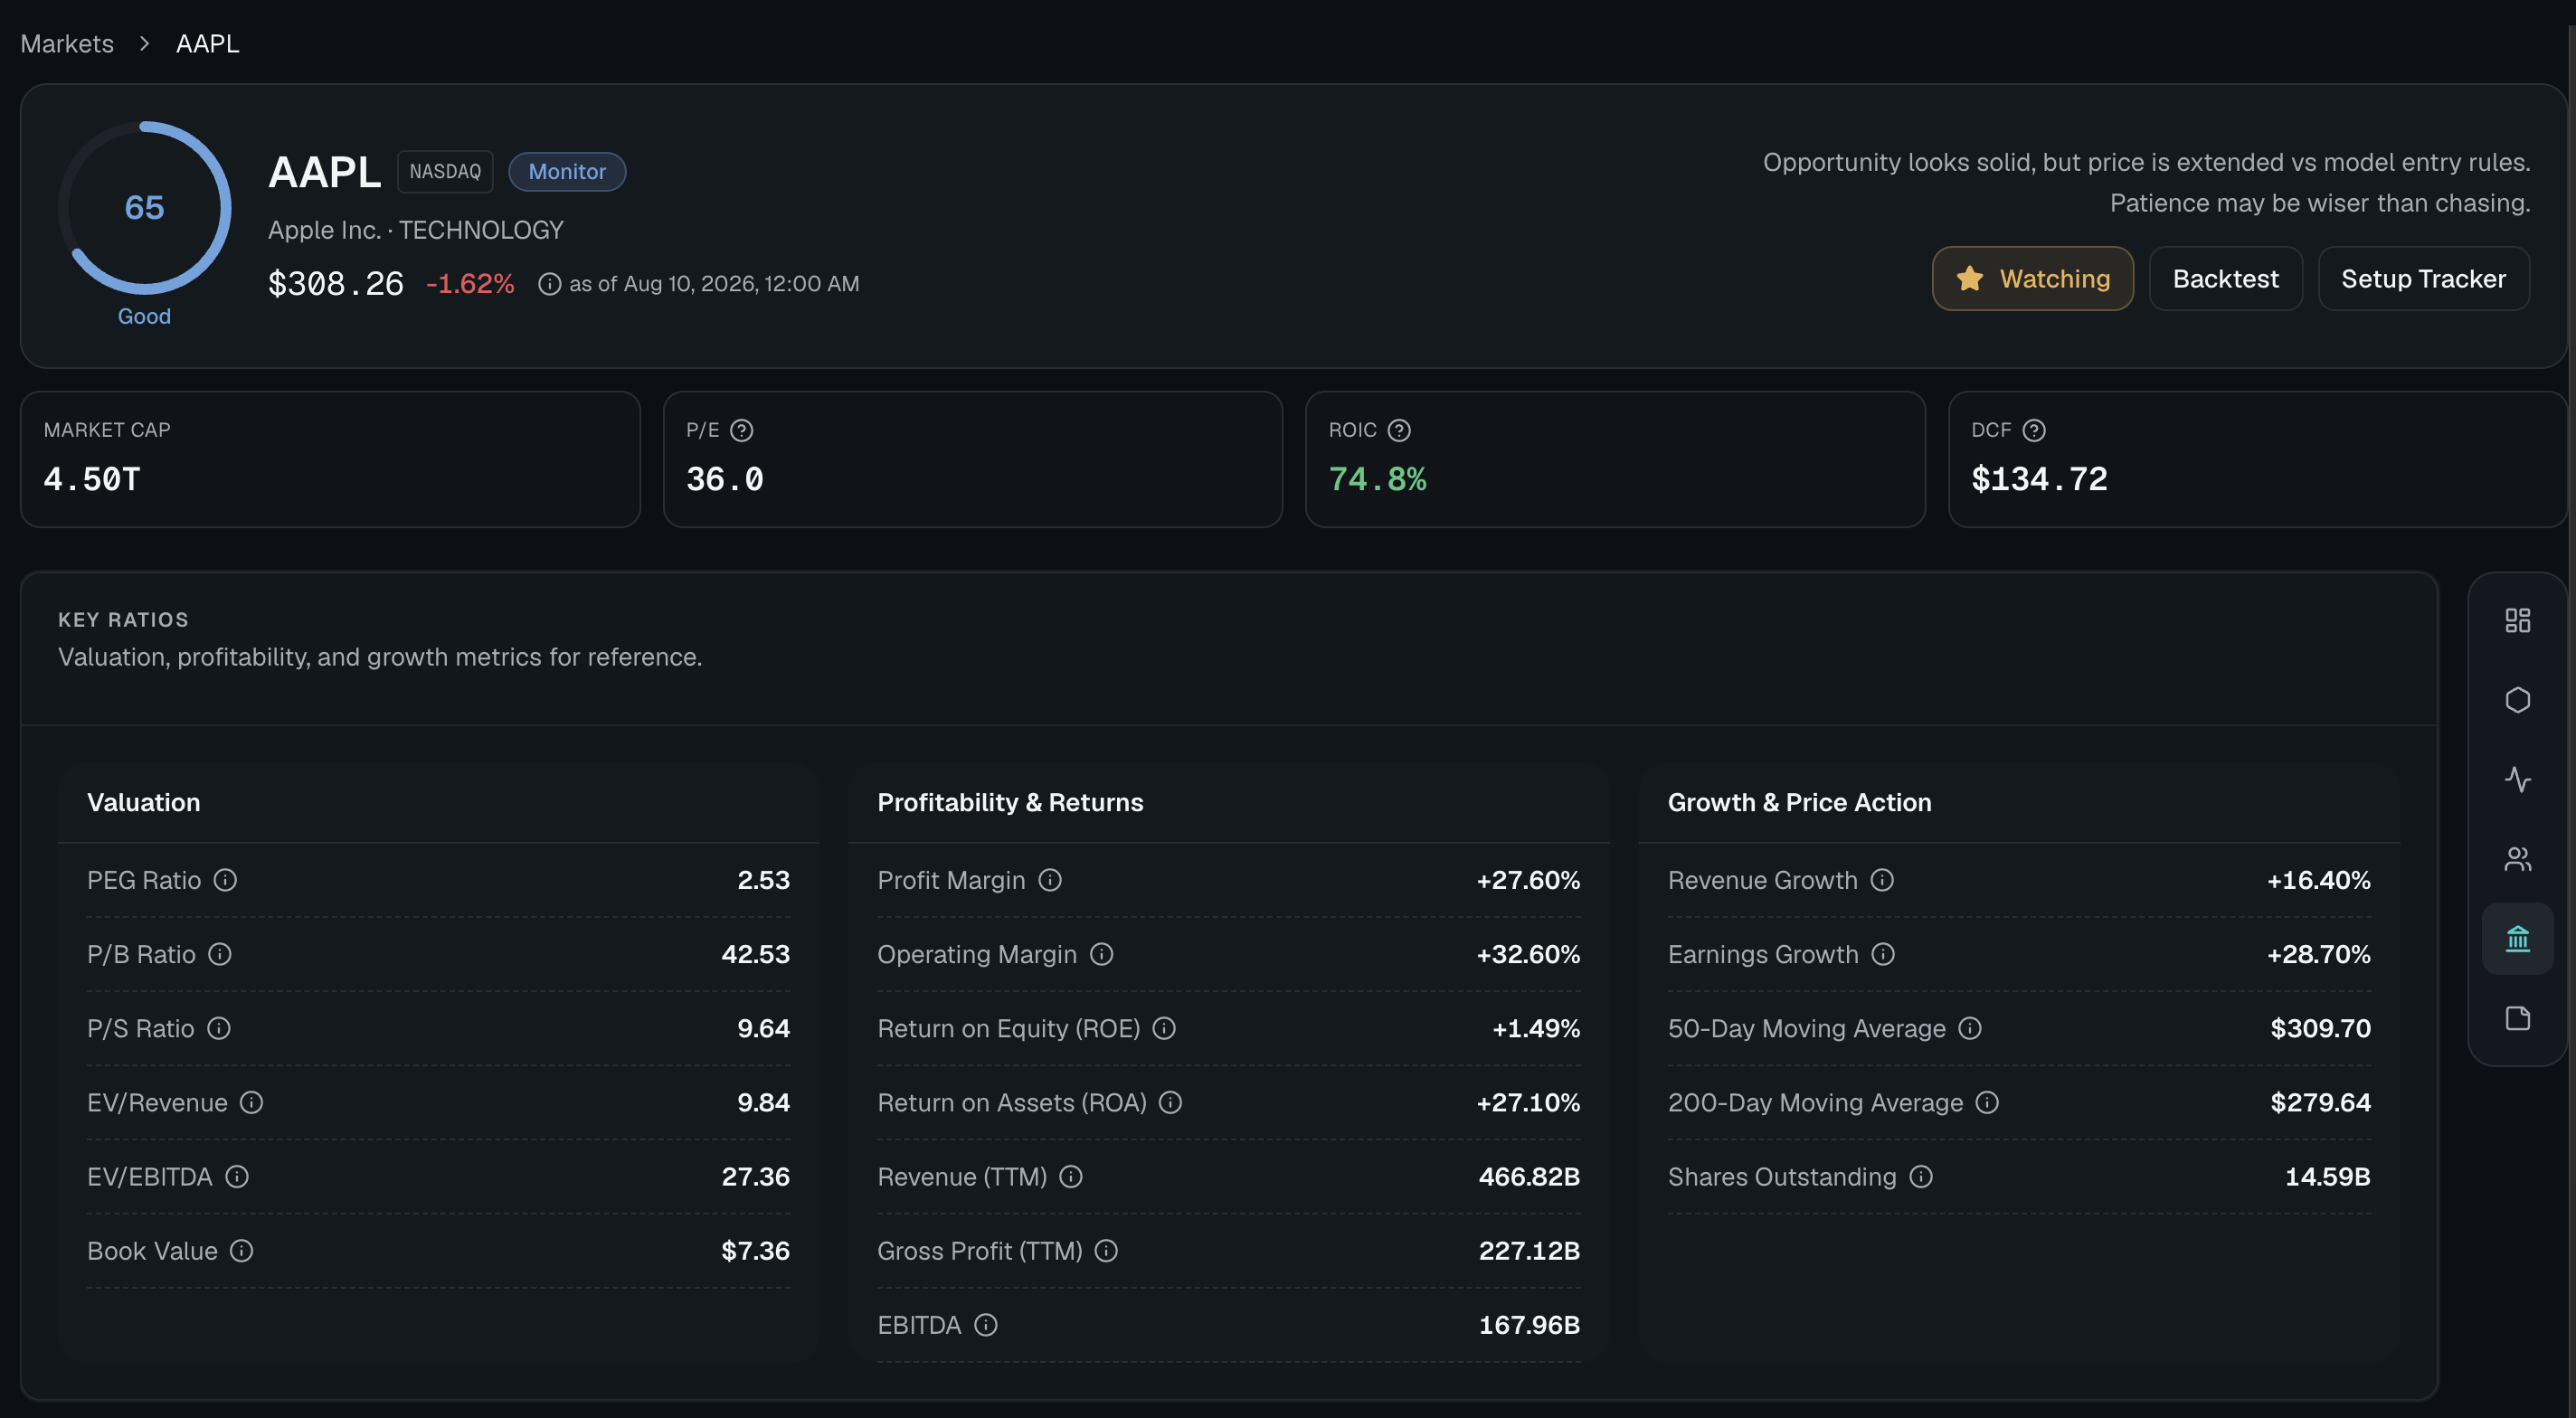
PRISM treats valuation as its own research lens so price and business quality are not collapsed into one vague impression. In product terms, valuation context sits beside quality, timing, and conviction as part of a research workflow.
What that means in practice:
Valuation is presented as context for research priority, not as a personalised cheap-or-expensive advice label.
Growth-adjusted and cash-aware views can sit beside earnings multiples.
Weak business quality is not rescued by a low multiple alone.
Exact lens weights are not published as marketing claims.
Four research lenses organise how you read an opportunity. That is a navigation frame, not a validated predictive ranking.
Conviction is unranked: holder context you can inspect, not an input that drives the Score.
The PRISM Score (0-100) is a research-priority model score. Rating bands (Highlighted, Elevated, Monitor, Weak setup, Low score) are scanning aids; a given band can be sparsely populated.
To see how PRISM frames valuation beside quality, timing, and conviction without collapsing research into a single tip, see how PRISM presents valuation context.
Your working checklist
Business model stated in one sentence before any multiple is used
Two or three metrics chosen because they fit this model, not because they are fashionable
Peer set competes for the same economics
Trailing P/E (if used) checked for losses, one-offs, and cycle position
Forward P/E (if used) tagged with whose forecast and as-of date
PEG (if used) formula confirmed before any cross-tool comparison
EV/EBITDA (if used) followed by a capex and cash-flow check
FCF yield (if used) checked for lumpiness and definition differences
Price implications written as assumptions, not as a cheap-or-expensive call
Primary filings opened for any contested input
Limitations
Valuation tools have structural limits. Markets can remain expensive or depressed longer than a tidy model expects. Peer medians are not intrinsic value. Forecast-driven multiples inherit forecast error. Cross-border accounting and disclosure differences reduce comparability. Data vendors can revise history. A coherent valuation view can still produce a losing investment if the business disappoints or if entry timing is poor.
The aim here is usefulness with uncertainty stated: clear definitions, failure modes, and no pretence that one ratio settles the question. Read the public methodology for how PRISM presents valuation as research context. This article does not present a public Track Record.
Risk disclosure
PRISM publishes market intelligence for education and research support, not as personalised advice. It is not a broker or an investment advisor, and this article should not be read as a recommendation to buy, sell, or hold anything. Investing can mean losing money. Model outputs and historical patterns are not a reliable guide to what happens next. Do your own work, and seek independent advice when that is appropriate for you. See the full risk disclosure and methodology.
Sources and methodology
Framing follows the public methodology: valuation as a research lens beside quality, timing, and conviction; Score as a 0-100 research-priority model score; lenses as a navigation frame rather than a predictive ranking; Conviction as inspectable context that does not drive the ranked Score; no internal lens-weight percentages; no public Track Record claims here. Primary sources include SEC EDGAR, SEC Company Facts, Investor.gov, FINRA, the FCA Investors hub, CFA Institute research materials, and FRED. Citations appear at the point of use above. Ratio discussions are educational and do not assert that any security is attractively priced.