research-workflows
How to Combine Fundamentals, Valuation and Technical Timing
A practical research sequence for combining business fundamentals, valuation context, and technical timing, without mechanically averaging signals or treating any lens as a buy recommendation.
For information and education only — not investment advice or a recommendation. Do your own research. Capital at risk.
The short answer
Combine fundamentals, valuation, and technical timing by giving each lens a job and a place in line. Start with the business: what it earns, how it grows, how it converts cash, and what could break. Then ask what the market price implies for that business. Only after those answers are clear should you ask whether trend and structure make attention sensible now, later, or not yet. The sequence is a research habit, not a formula that averages signals into a verdict.
Why this matters
The hard part is not collecting more inputs. It is stopping the loudest chart, the favourite brand, or the lowest multiple from vetoing quieter evidence.
Mix the lenses and two category errors show up fast. You treat a strong company as a good entry. Or you treat a clean chart as a durable business. Either way you spend attention on the wrong question, then write a story that makes the first conclusion feel inevitable.
Investor.gov and FINRA still put primary research first: know what you own, how it makes money, and what could go wrong. A sequence is how those habits survive a noisy week.
This article is educational process guidance for self-directed investors. It is not personalised advice and not a recommendation to buy or sell any security.
What fundamentals answer
Fundamentals answer questions about the economic engine. Is revenue growth real, durable, and reasonably diversified? Do margins and returns on capital support the story you are telling? Does cash flow confirm or challenge reported earnings? Can the balance sheet fund the plan through a slower year? What would falsify the thesis?
Primary documents matter. For US issuers, that usually means filings via SEC EDGAR. Education pages from Investor.gov and FINRA emphasise disclosures over social proof for the same reason: summaries compress; filings still contain the exceptions.
Fundamentals move slowly relative to daily prices. That is a feature. They tell you whether a name deserves a place in your research universe. They do not, by themselves, tell you whether this week is a sensible moment to act.
What valuation answers
Valuation answers a different question: given the business you think you understand, what are you being asked to pay?
Useful valuation work is comparative and scenario-based. Compare multiples with the company's own history when the model is stable enough for history to help, and with peers that actually compete for the same economics. Add growth-adjusted context with the caveats those ratios deserve, cash-flow yields when free cash flow is meaningful, and a short sensitivity note: what growth and margin path would make today's price look reasonable later?
Valuation does not declare a stock cheap as a call in this article. It clarifies the burden of proof. A strong business at a demanding price needs more durable growth and less operational error. A weaker business rarely becomes a strong research priority just because a multiple looks low.
Metric literacy helps. P/E, PEG and EV/EBITDA explained covers how common ratios differ and when each is less useful. CFA Institute materials treat multiples as tools that need accounting and risk context, not as standalone verdicts.
What technical timing answers
Technical timing answers questions about market participation and structure. Is the higher-timeframe trend supportive, neutral, or damaged? Is price extended after a vertical move, or compressing after digestion? Does the daily picture suggest patience, rebuilding, or ongoing stress? Are you looking at a pullback in an intact regime or a breakdown dressed up as a bargain?
Professional technical education, including resources associated with the CMT Association, frames this work as the study of price, volume, and risk. It is complementary to fundamental analysis, not a replacement for it.
Timing does not certify intrinsic value. It helps you avoid paying peak urgency for a story you already like, and it helps you notice when market structure no longer matches a calm compounder narrative. Great Company, Bad Entry is the dedicated walkthrough of that split.
Why one lens is never enough
Each lens fails in predictable ways when used alone.
Fundamentals alone. You can be early by years, or late into a crowded re-rating, while still being "right" about the business. You can also underweight how much future success is already in the price.
Valuation alone. Low multiples can mark deteriorating businesses. High multiples can mark extraordinary economics, or fashion. Without quality context, valuation becomes a sorting hat for stories you have not read.
Timing alone. Charts can look constructive on weak economics for longer than is comfortable, then reverse without warning. Momentum is not a cash-flow statement. Extension can persist. So can short-lived bounces in damaged names.
The research failure mode is not "using multiple methods." It is using them out of order, or letting the loudest lens silence the quiet evidence. A clean daily chart should not override a broken cash-flow story. A beloved brand should not override a weekly breakdown if your process says structure matters.
A practical research sequence
Use a fixed order so emotions have fewer places to hide. The steps below are a teaching sequence. They are not a scoring model and they do not publish product weights.
Step 1: Define the research object
Write one paragraph: what the company does, who pays it, and why that might persist. If you cannot do this without marketing slogans, you are not ready for valuation or timing debates.
Step 2: Fundamentals pass
Complete a structured pass on growth, profitability, cash, and the balance sheet. Decide: research-worthy, watchlist with open questions, or pass.
If the answer is pass, stop. Do not resurrect the idea because the chart looks energetic later that day.
Step 3: Valuation context
Only for names that cleared the quality gate. Ask what the price implies. Identify the two or three assumptions that matter most. Note what would make the price look demanding versus more reasonable, without turning the note into a target-price service.
Step 4: Timing and patience
Inspect Long-term (weekly) structure first, then Position (daily) detail, on the timeframes PRISM currently generates. Decide whether your process says: dig deeper now, wait for better structure, or reduce priority because the regime is damaged.
Step 5: Cross-check and monitoring plan
Write what would upgrade the idea, what would downgrade or kill it, and what you will review after the next earnings or filing cycle. Holder filings can sit here as optional context. They do not replace the business paragraph, and they do not rank the name for you.
Step 6: Separate the decision from the dashboard
A dashboard can gather lenses. You still own the decision. Tools should make the sequence easier to repeat. They should not automate judgement you have not defined.
The table below is a teaching aid. It does not describe a real ticker, and it is not a recommendation.
| Case | Fundamentals | Valuation context | Timing | Research posture |
|---|---|---|---|---|
| A | Strong, durable, cash-generative | Demanding if growth must persist | Weekly intact; daily extended | High-quality watchlist; wait for digestion rather than chase |
| B | Strong | Reasonable versus peers and history for the model | Weekly and daily constructive | Deeper work now; still define invalidation |
| C | Mixed; cash conversion weak | Looks low on earnings | Chart rising hard | Low priority; a low multiple may be a trap narrative |
| D | Strong historically | Still interesting on paper | Weekly breakdown | Thesis review; do not treat the move as a routine pullback |
| E | Weak economics | Any | Any | Pass; spend attention elsewhere |
Notice what the framework refuses to do. It never lets Case C become urgent because timing is exciting. It never lets Case A become urgent because the business is strong.
What not to combine mechanically
Multi-lens research goes wrong when it becomes arithmetic theatre.
Do not average conflicting signals into fake certainty. "Fundamentals plus two, valuation minus one, timing plus one, overall plus two" is not analysis. Conflicting evidence should remain conflicting until you resolve it with judgement, or until you decide the idea is not ready.
Do not let position size hide process failure. Taking a tiny position in a confused idea is still a confused idea if you cannot state the thesis. Small size can be risk management. It is not a substitute for clarity.
Do not mix time horizons silently. A three-year quality thesis paired with a two-day momentum trigger needs explicit rules. Otherwise you will use the long horizon to justify holding losers and the short horizon to justify chasing.
Do not import other people's weights as your philosophy. Product scores and research lenses can prioritise attention. They should not become a belief that a secret formula has removed uncertainty. PRISM does not publish internal lens-weight percentages as marketing claims, and this article will not invent them.
Do not treat a data feed's refresh time as truth freshness. Know what is delayed, adjusted, or incomplete. A vendor timestamp does not certify that your interpretation is correct.
Do not confuse overlap of methods with proof. If price is rising and earnings are rising, that can be healthy alignment, or late-cycle enthusiasm. Ask which regime you are in before you treat the overlap as settled evidence.
Common mistakes
- Starting with the chart, then hunting for a fundamental story that fits
- Treating a demanding multiple as irrelevant because "quality always wins"
- Treating a low multiple as a reason to own a business you have not understood
- Averaging Quality, Valuation, and Timing into one fake overall score
- Using a weekly thesis to justify a daily chase, or the reverse, without saying so
- Copying holder filings as if they ranked the name for you
- Skipping SEC EDGAR because a dashboard already "did the work"
How PRISM helps
PRISM is one research workspace for self-directed investors who already think in multiple lenses.
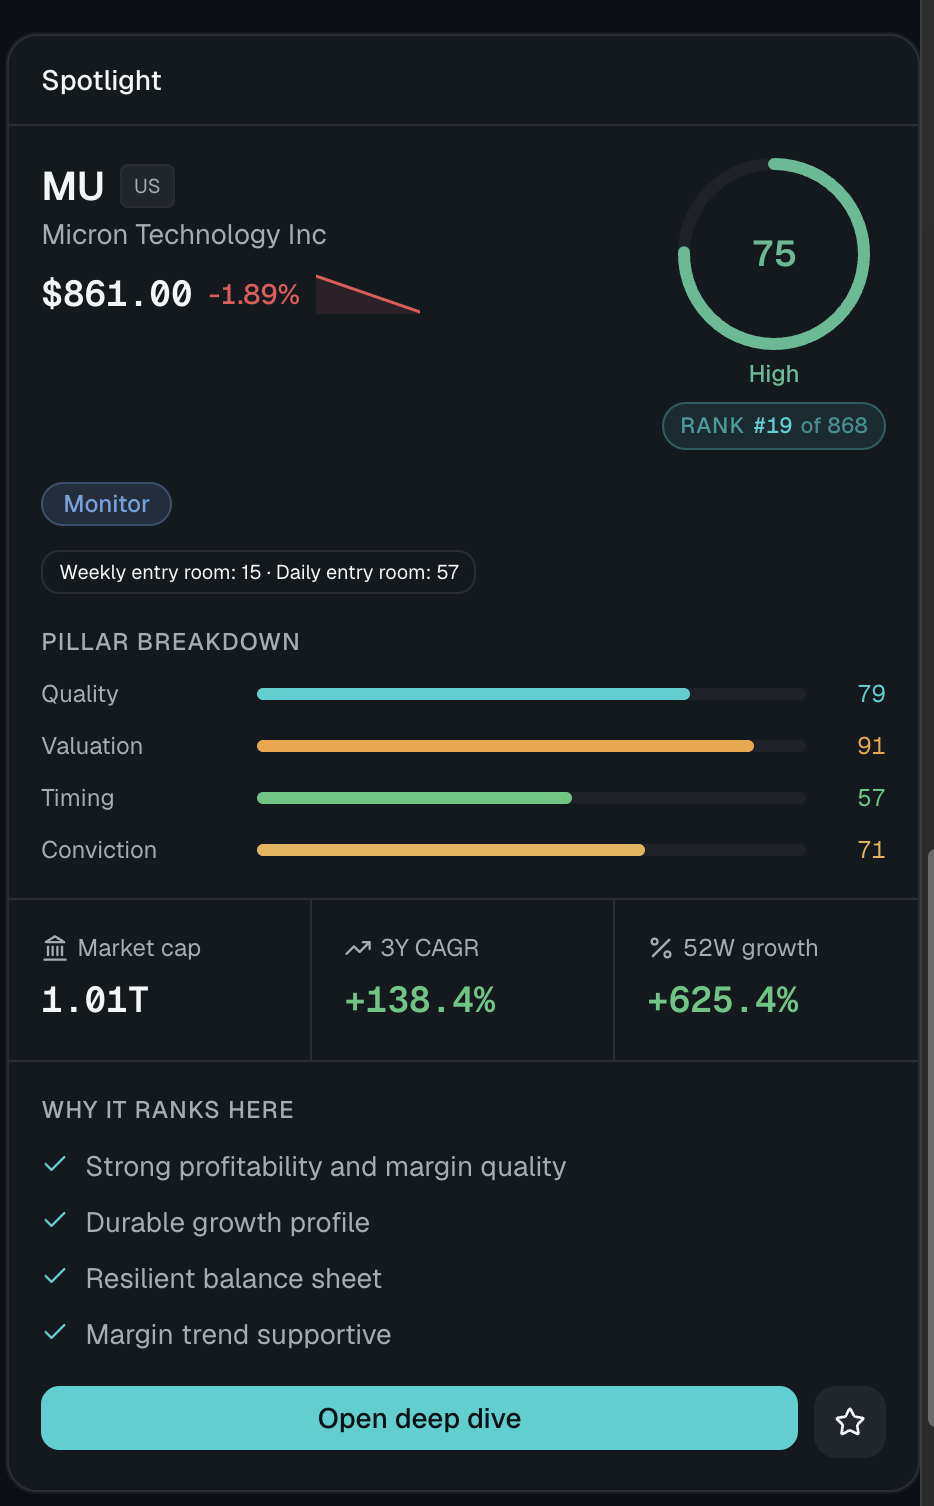
You navigate with four research lenses: Quality, Valuation, Timing, and Conviction. That framing helps you see where attention is going. It is descriptive navigation for research, not a claim that the lenses have been validated as a predictive ranking.
How the pieces map to this article's sequence:
- Quality: business strength and durability as the foundation for discovery.
- Valuation: a separate question about what you pay for that quality.
- Timing: structure and model status so strong names are not automatically treated as immediate entries. Setup lexicon uses statuses such as Emerging, Favourable, and Monitoring (and later outcomes such as Target reached, Stop reached, Expired, Unfavourable, and Invalidated) on the timeframes PRISM currently generates. This article focuses on Long-term (weekly) and Position (daily).
- Conviction: optional context from longer-term holder filings, with delay and non-copy-trade caveats. Conviction is unranked: it does not drive the Score.
The PRISM Score (0-100) is a research-priority model score: a starting point for where to dig, not a forecast of returns. Rating bands (Highlighted, Elevated, Monitor, Weak setup, Low score) are scanning aids. A given band can be sparsely populated. PRISM does not publish those weights.
Start a free PRISM research workspace
Your working checklist
- Business paragraph written in plain language
- Fundamentals gate completed (growth, profit, cash, balance sheet, falsifiers)
- Valuation context completed only if quality cleared the gate
- Weekly regime named before daily entry chatter
- Pullback versus breakdown distinguished explicitly
- Conflicts between lenses written down, not averaged away
- Monitoring triggers defined (earnings, filings, structure breaks)
- No lens used as a substitute for primary disclosures
- Decision recorded as research priority, wait, or pass, not as destiny
Limitations
Combining methods improves process quality. It does not create certainty.
A careful process can still lose money. Data can be revised. Filings can surprise. Markets can gap. Peer groups are judgement calls. Technical levels are not laws of physics. Scores and labels compress complexity; decompression is your job. This article does not present a public Track Record and does not claim strategy performance.
Regulatory and education context: FCA InvestSmart reminds investors that capital is at risk. PRISM is a research and education product. It is not advice tailored to you, and it is not FCA-authorised investment advice. Read the public methodology for how lenses, Score, and Setup are framed.
Risk disclosure
The value of equities can go down as well as up, and you may receive back less than you put in. This article does not offer, solicit, or personally recommend any purchase or sale of securities. The illustrative cases are teaching tools only.
Before you lean on any product output, read PRISM's risk disclosure and methodology. Prior company results, rankings, and model statuses are not a reliable guide to future results.
Sources and methodology
Framing follows the public methodology: four research lenses as a navigation frame, Score as a 0-100 research-priority model score, Conviction as inspectable context that does not drive the ranked Score, Setup timing as a separate layer on the timeframes PRISM currently generates, no internal lens-weight percentages, and no public Track Record claims here. Primary education sources include CFA Institute refresher readings, the CMT Association, Investor.gov, FINRA, SEC EDGAR, and FCA InvestSmart. Citations appear at the point of use above. Always check as-of dates on names that matter to you.
Last reviewed: 2026-08-16
See the product
Ranked Opportunity Radar with quality, valuation, growth, timing, and conviction pillars, so research stays organised before you act.
Try Radar free
Explore the deeper Radar workflow free for a limited time. Basic research stays free forever — no credit card to start.
For information and education only. Capital at risk.
Sources
Related reading
- P/E, PEG and EV/EBITDA: Which Valuation Metric Should You Use?
A clear guide to P/E, forward P/E, PEG, EV/EBITDA and free-cash-flow yield: what each measures, when each fails, and how to compare companies without treating one ratio as a verdict.
- Great Company, Bad Entry: Why Stock Quality and Timing Are Different
A strong business can still be a poor entry. Learn how to separate company quality, valuation context, and technical timing, and why chasing extended quality names is a common research mistake.
For information and education only — not investment advice. Capital at risk. How PRISM works · Risk disclosure · Methodology methodology-2026-08