Learn what price extension means, how moving averages and RSI add context, how to tell a breakout from a chase, and how patient timing labels support better research discipline.
For information and education only — not investment advice or a recommendation. Do your own research. Capital at risk.
The short answer
You avoid chasing an overextended stock by splitting business quality from entry timing, then checking how far price has run before you treat a strong story as an urgent entry. Measure distance from meaningful averages, read RSI as context, prefer a confirmed base over a late vertical move, and write pullback conditions in advance. Patient research often looks like Emerging or Monitoring while a name is stretched. Patience is a decision, not a promise that a cleaner entry will appear.
Why this matters
Plenty of investors can find interesting companies. Discipline breaks after a strong advance: the story feels confirmed, the chart looks decisive, and waiting feels like missing out.
That is the expensive habit. A durable business can still be a poor place to deploy capital if price has travelled far ahead of a constructive setup. Quality does not rewrite geometry. For the broader framing of that split, see Great Company, Bad Entry.
Investor.gov and FINRA keep returning to process and risk awareness. Technical timing is one place where process gets tested in real time. The cost of getting it wrong is not only a late fill. It is a thesis that now needs a heroic recovery just to get back to the idea you originally liked.
This article is educational. It does not identify securities to buy or sell, and it does not present live Radar names as tips.
What extension means
Extension usually means price has moved a long way, quickly, relative to a reference such as a moving average, a recent base, or a momentum range. The stock may still be in an uptrend. Extension is not automatically a sell signal. It is a warning that near-term reward-to-risk may be less favourable than it looks on a short highlight reel.
Keep three questions separate:
See the product
Ranked Opportunity Radar with quality, valuation, growth, timing, and conviction pillars, so research stays organised before you act.
A strong business can still be a poor entry. Learn how to separate company quality, valuation context, and technical timing, and why chasing extended quality names is a common research mistake.
PRISM Score is a longer-lived research-priority model score. PRISM Setup is the current technical state on the timeframes PRISM currently generates. Learn how they differ, when they pull apart, and how to use each without treating either as a tip.
For information and education only — not investment advice. Capital at risk. How PRISM works · Risk disclosure · Methodology methodology-2026-08
Trend asks whether the larger direction is intact.
Extension asks whether the latest advance has become stretched inside that trend.
Structure asks whether price is leaving a constructive base or simply running away from one.
You can have a strong trend and still have poor entry quality. That is the whole point of patient labels. A name can deserve a research file and still not deserve urgency today.
Write the word "extended" only when you can point at a reference. "It looks high" is a feeling. Distance from an average, location versus the last base, and weekly context are observations you can revisit next week without rewriting history.
Moving-average distance as context
Widely used moving averages help translate "it looks high" into something you can review. They do not predict the next session. They locate price relative to a path that many participants already watch.
Common checks on Position (daily) and Long-term (weekly) charts:
Distance from a shorter average such as a 20-day or 50-day mean
Distance from a longer average such as a 200-day mean
Whether weekly averages still slope higher even if daily price is stretched
Whether price is extended on both timeframes or only on the lower one
A large gap above a rising average can mean strength. It can also mean that an average entry now sits on thin air if the move pauses. Neither interpretation should be automatic.
Technical education bodies such as the CMT Association treat indicators as tools with assumptions and failure modes, not as prediction machines. Use averages the same way: context, not certainty.
Practical notes:
Compare distance with the stock's own history where possible. Some names habitually trend farther from averages than others.
Prefer percentage distance or standardised measures over eyeballing candles.
If weekly structure is damaged, "buy the dip" language can become hope rather than analysis.
A rising average with price hugging it is a different picture from a rising average with price several times the usual gap above it.
Do not turn any one average into a ritual. The job is to notice stretch, not to worship a lookback. If you cannot say which average you are using and why it fits the horizon of your thesis, you are still eyeballing.
RSI and momentum context
Relative Strength Index (RSI) is often summarised as "overbought" or "oversold." That shorthand is incomplete.
A more useful reading:
High RSI after a vertical advance can mark stretch.
High RSI in a strong trend can persist longer than late entrants expect.
Falling RSI while price makes marginal new highs can hint at momentum fatigue.
RSI alone does not say whether a business is worth owning.
Treat RSI as one timing input among several. Pair it with trend, average distance, volume behaviour, and higher-timeframe confirmation. Do not treat a single threshold as an automatic action rule.
Market-data platforms often compute RSI from price history, and they do not all use the same price field or lookback. If two tools disagree, check each platform's settings before you invent a market story.
Momentum tools fail in familiar ways. They lag. They stay elevated in trends. They whip around in ranges. That is expected. The research use is to notice when stretch, structure, and momentum tell the same story, and when they do not. Disagreement is a reason to slow down, not a reason to pick the reading that matches your urge.
Price structure: bases, breakouts, and late runs
Structure is where many chase mistakes become visible. A breakout here is a price-structure idea: price leaving a defined range. It is not a PRISM setup status.
Constructive structures
A multi-week or multi-month base with declining volatility
A move out of that base with participation that looks broader than a one-day spike
A first pullback that holds above the prior range or a key average
Weekly closes that confirm the daily move rather than reject it
Chase-prone structures
A straight-line advance far above the last consolidation
Gap after gap with little pause for digestion
Range exits that immediately extend many average true ranges in a few sessions
Strength that exists only on the daily chart while the weekly chart looks late or heavy
The same ticker can look like a constructive range exit on Tuesday and a chase by the following month. The difference is usually location in the move, not the logo on the chart. If you cannot point at the last base, you are already late in the description, even if you still like the company.
Volume, when it is available and meaningful for that listing, can support the read. It cannot rescue a location that is already stretched. Thin names can also gap through any "ideal" zone you drew. Structure is a map. It is not a contract with the market.
Breakout versus chase
Use a simple decision table in your notes. Again, "breakout" here means price leaving a base. It is not a product status.
Question
More breakout-like
More chase-like
Where is price relative to the last base?
Just leaving it
Far above it
Has the move had time to digest?
Some consolidation exists
Almost none
What does the weekly chart say?
Confirms the advance
Looks mature or stretched
What is the plan if the next three sessions reverse?
Invalidation is clear and close enough to respect
Invalidation sits so far away that the idea depends on continuation
Why today?
Structure changed
Fear of missing more upside
If your honest answer to "why today?" is urgency rather than structure, you are closer to a chase.
Write the table before you open an order ticket, or before you even put the name on a "act soon" list. After a vertical week, memory edits the base. People remember the last tight range and forget how far price has already travelled from it.
A chase is not a moral failing. It is a location error. You can still like the business. You can still keep the file. What you should not do is let FOMO reclassify a late run as a fresh range exit.
Pullback conditions worth writing down
Waiting is not a strategy unless you define what you are waiting for. Before a strong name runs away from you emotionally, write pullback conditions such as:
Price returns toward a rising short- or intermediate-term average without breaking the larger trend.
The pullback holds above the prior range floor or consolidation.
Momentum cools from extreme readings without a weekly trend break.
Volume behaviour during the pullback does not look like urgent distribution, to the extent volume is available and meaningful for that listing.
Your fundamental thesis is unchanged while you wait.
If those conditions never appear, the disciplined outcome may be that you simply do not get an entry you like. That is an acceptable research result. Missing a move is not the same as making a poor entry and then needing a heroic recovery.
Revisit the list after earnings, guidance changes, or a weekly trend break. Pullback rules written for an intact uptrend do not automatically survive a broken weekly structure. If the thesis changed, the wait is no longer the same wait. Update the note or close the file.
Do not shrink the pullback after the fact so that a tiny dip still "counts." That is anchoring to the recent high with extra paperwork.
Weekly confirmation on Long-term charts
The timeframes PRISM currently generates are Long-term (weekly) and Position (daily). That pairing exists for a reason: daily strength can look persuasive while weekly structure says the advance is late, opposing, or damaged.
Weekly confirmation questions:
Are weekly moving averages still supportive?
Are weekly closes confirming the daily range exit or rejecting it?
Is the weekly trend intact, repairing, or broken?
Does the weekly chart look extended even if the daily dip looks buyable?
If daily and weekly disagree, patience usually belongs to the higher timeframe until the conflict resolves. That is research hygiene, not a prediction that weekly will always win.
A daily dip inside a late weekly advance is a common trap. The lower timeframe offers a story that feels like a discount. The higher timeframe still says the move is mature. You do not have to forecast a crash to choose patience. You only have to admit that the two clocks disagree.
Shorter swing-style windows are not currently generated as a live PRISM surface. If you use them in your own notes, keep them labelled as your overlay, not as a product status.
Common mistakes
Using quality as permission to chase. A strong franchise does not rewrite entry geometry. The company can still deserve a file.
Anchoring to the recent high. Waiting for a tiny dip after a vertical move is still often a chase.
Ignoring the weekly chart. Daily pullbacks inside a late weekly advance deserve scepticism.
Confusing FOMO with opportunity. Urgency is not analysis. "Why today?" should have a structural answer.
Moving invalidation after entry. If the only way the idea survives is hope, the idea has changed.
Treating overbought as an automatic short. Stretch can persist. The first job is usually to avoid a late long entry, not to invent the opposite trade.
Skipping primary filings because the chart is loud. Timing research still has to reconnect to the business. Use SEC EDGAR when the story has become the whole argument.
How PRISM helps
PRISM is explicit that a strong research candidate is not automatically an immediate entry candidate. Opportunity quality and setup timing are related but different layers. For the product distinction, see PRISM Score vs PRISM Setup.
The PRISM Score is a 0-100 research-priority model score. It helps you decide which names deserve a closer look. It is not a forecast, not a buy or sell call, and not a claim that a high score means "act now." Rating bands (Highlighted, Elevated, Monitor, Weak setup, Low score) are scanning aids. They are not personalised advice, and a given band may be sparsely populated depending on current scores.
PRISM Setup is a separate technical state on the timeframes PRISM currently generates: Long-term (weekly) and Position (daily). User-facing statuses include Emerging, Favourable, Monitoring, Target reached, Stop reached, Expired, Unfavourable, and Invalidated. Patient research on an extended name often lives in Emerging or Monitoring, even when you still like the business. Favourable means model rules currently classify conditions as favourable for further research attention. It is not an instruction to buy.
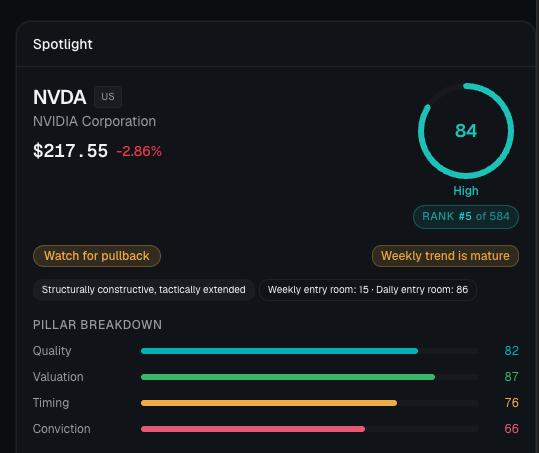
Research lenses (Quality, Valuation, Timing, Conviction) organise attention. They are not a validated predictive ranking. Conviction is inspectable context. It does not currently drive the ranked Score.
I can explain the business thesis without referring to the last five green candles
I know whether I am evaluating Long-term (weekly) regime, Position (daily) timing, or both
I have measured extension versus relevant averages, not only "it looks high"
RSI or other momentum tools are used as context, not as an automatic trigger
I can tell whether price is leaving a base or running far above one
I have written pullback conditions in advance, and I will not shrink them after a tiny dip
Weekly structure agrees enough to justify urgency, or I am choosing patience
Invalidation is defined before entry interest becomes emotional
I accept that no setup appearing is an acceptable outcome
I am reading Emerging, Favourable, and Monitoring as research context, not as orders
I am not treating any model label as a substitute for my own decision process
If the checklist fails and you still feel pressure to act, the pressure is information. It usually means the chart is recruiting you faster than your process can keep up.
Limitations
Timing discipline has limits.
Strong trends can stay extended longer than patient rules feel comfortable with. Pullbacks can fail and become breakdowns. Indicator settings differ across platforms. Illiquid names can gap through "ideal" re-entry zones. A well-timed entry can still lose money if the thesis is wrong. No checklist removes market risk.
PRISM outputs are research context under stated methodology. They are not personalised advice, not a suitability assessment, and not a public Track Record claim. Model statuses can be wrong for a name, a regime, or a period. Missing fields, vendor limits, and filing delays all affect what you see.
FCA investor resources and US investor-education sites make the same underlying point in different words: tools and communications should help you understand risk, not hide it.
Risk disclosure
Nothing in this article is investment advice or a call to trade. PRISM offers market intelligence for information and education; it is not a broker, advisor, or place to execute orders. You can lose capital when you invest. Past results and model behaviour are not a reliable guide to future outcomes. Research independently, and consider professional advice suited to your situation. The full risk disclosure applies.
Sources and methodology
Technical timing ideas here follow public education practice from the CMT Association, with investor-process framing from Investor.gov, FINRA, and the FCA Investors hub. Company filings, when timing research must reconnect to fundamentals, belong on SEC EDGAR. Indicator recipes vary by platform; check price field and lookback settings when two tools disagree. PRISM framing follows the public methodology: Score as a 0-100 research-priority model score; Setup statuses Emerging through Invalidated on Long-term and Position views; research lenses as a navigation frame, not a validated predictive ranking; Conviction as context that does not currently drive the ranked Score; no internal pillar weight percentages; no live ticker examples or fabricated returns as recommendations.